PRODUCTION WORK & IMPACT
Featured Work & Data Systems
A selection of data systems, revenue analytics frameworks, and optimization engines built over 6.5+ years across ad-tech, ed-tech, and high-growth digital commerce.
Selected Impact & Domain Work
1. Revenue Forecasting & Pipeline Intelligence
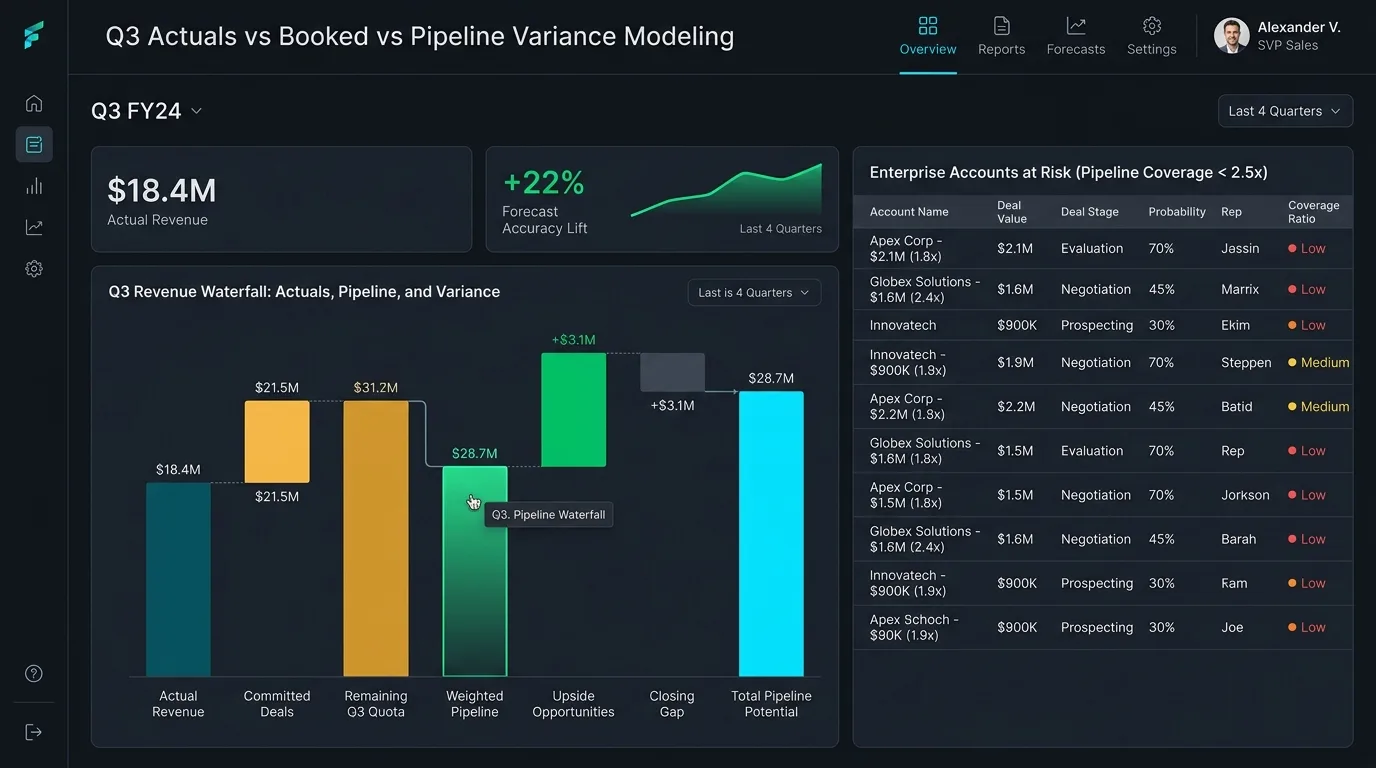
Built a comprehensive variance-analysis framework comparing Actuals vs. Booked revenue vs. Pipeline to detect quota risks early via pipeline coverage ratios. Delivered actionable share-of-wallet analysis and cross-platform spend benchmarking across major advertiser accounts.
Key Impact:
+22% Forecast Accuracy LiftEnabled Proactive Quarterly InterventionsEarly Quota Risk Detection
2. Learner Journey Optimization
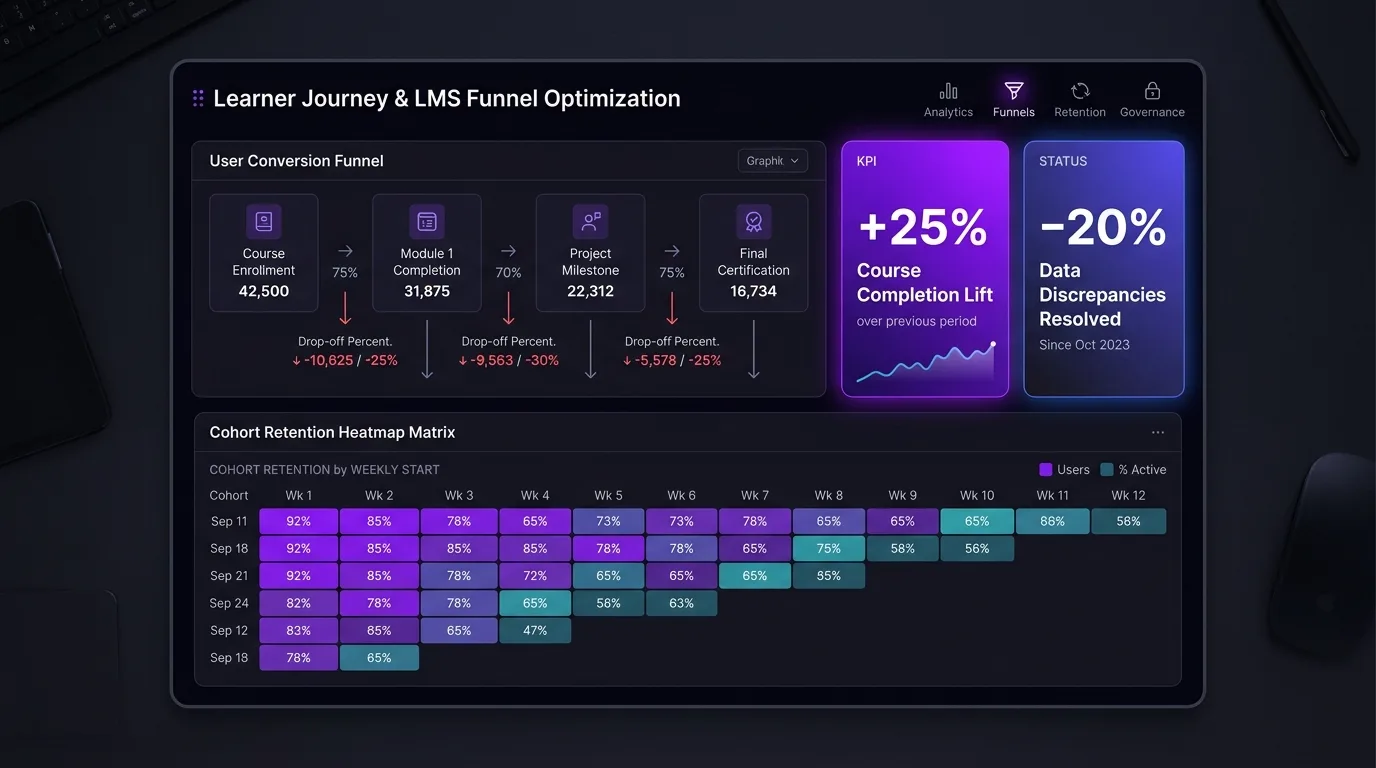
Conducted behavioral drop-off analysis across the LMS funnel to identify critical churn points and deploy targeted interventions. Executed end-to-end course audits and master data management (MDM) cleanups to establish a reliable, single-source-of-truth curriculum catalog.
Key Impact:
+25% Course Completion+15% Engagement+30% Course Variety-20% Data Discrepancies
3. Multi-Brand Growth Analytics at Scale
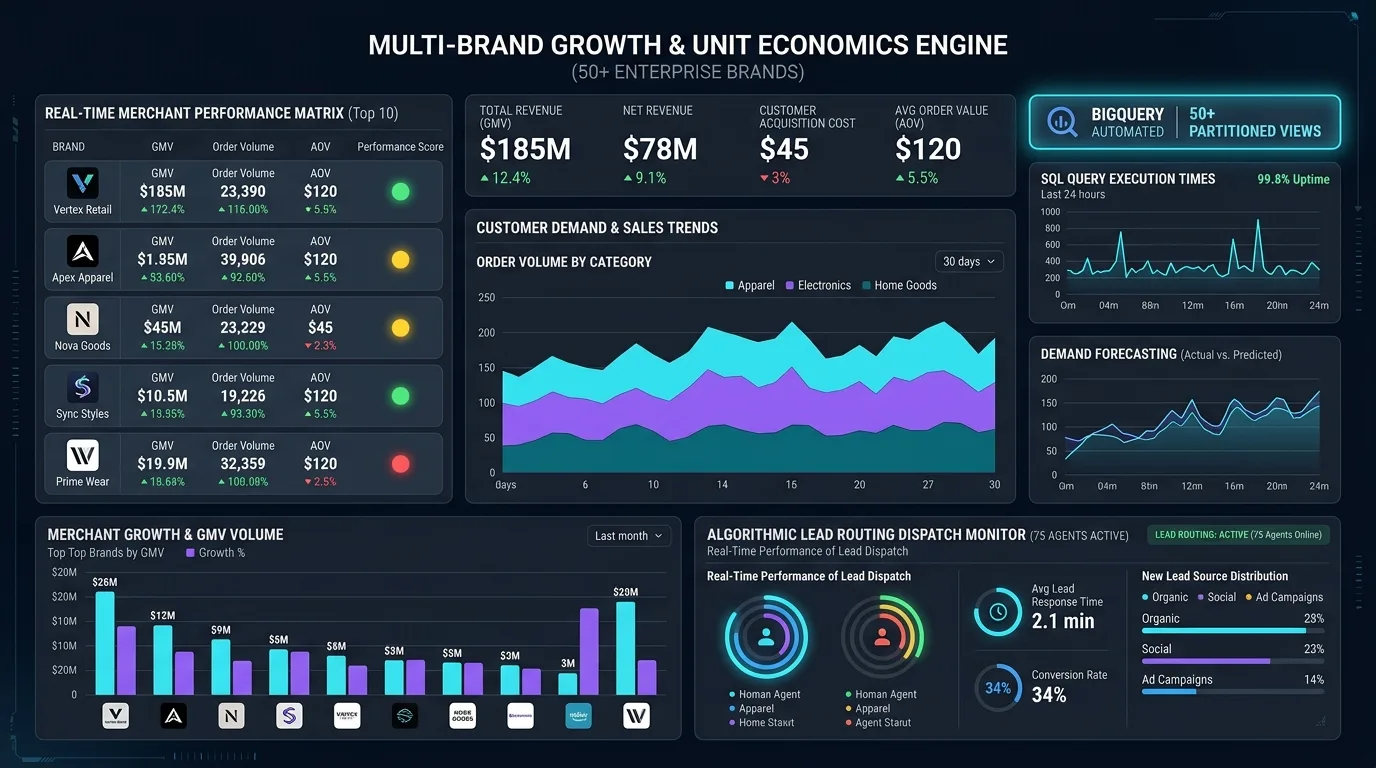
Engineered automated SQL and BigQuery reporting pipelines tracking unit economics, customer demand, and market share across 50+ enterprise brands. Eliminated key operational bottlenecks by redesigning the automated lead-distribution engine across a 75-agent sales team.
Key Impact:
+22% Revenue Growth+15% Market Share+25% Agent Productivity+10% Conversions
Deep Dive Case Study: Revenue Data Reconciliation & Anomaly Agent
The Problem
Revenue teams don't lose trust in their data all at once — it erodes one silent error at a time. A single mis-flagged row in a source sheet can ripple into a forecast, a board deck, or a KPI review before anyone notices. Most monitoring stops at "something's wrong" — it rarely tells you what, why, or how urgent.
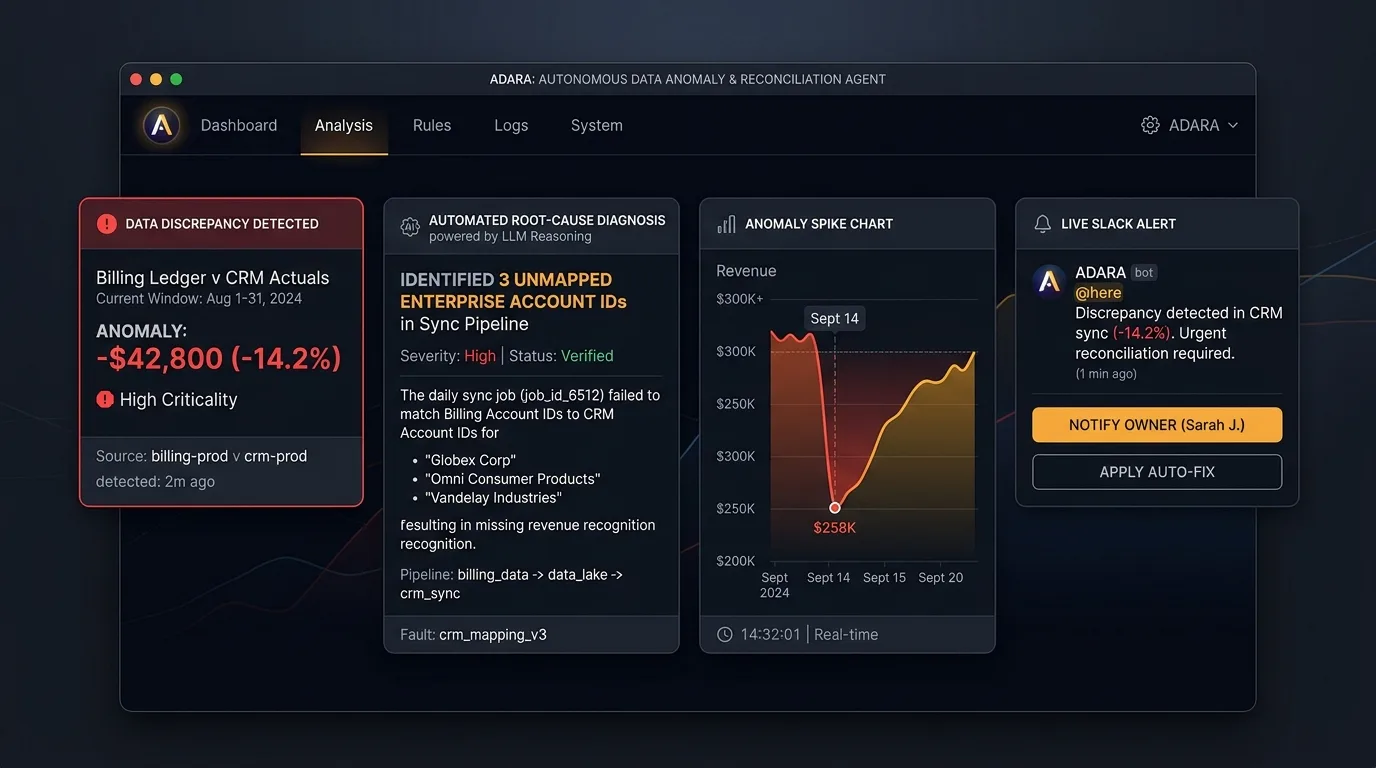
This project started as a simple monitoring workflow and grew into a full reconciliation and anomaly-detection system — one that doesn't just flag issues, but explains them in plain language.
What I Built
LAYER 01
1. A rule-based detection layer
A monitoring workflow built on Google Apps Script that watches a live revenue extract sheet, flags rows failing validation checks, and highlights them directly in the source — no separate tool for the team to check.
LAYER 02
2. A synthetic test dataset with planted anomalies
To validate detection accuracy without touching real business data, I built a synthetic dataset with known, deliberately planted errors — then scored the detection layer against that ground truth to measure precision and recall.
LAYER 03
3. An AI reasoning layer
On top of rule-based detection, I added a narrative layer that explains why a flagged row looks anomalous in plain language — turning a red cell into an actual explanation a non-technical stakeholder can act on.
LAYER 04
4. Automated delivery
Alerts route to Slack and email automatically, so the right people see issues the moment they're detected — not during a weekly review when the damage is already done.
Why It Matters
This isn't a proof-of-concept — it's built the way I'd want a production data-quality system to work: rule-based checks you can fully trust, paired with AI-generated explanations that save someone the job of digging through rows manually. It's the same discipline I bring to revenue analytics work day to day —validate first, automate second, explain always.
Core Technologies & Tools
1-ON-1 DATA ADVISORY
Facing similar data or revenue bottlenecks?
Book 30 minutes to review your warehouse setup, metrics disagreement, or reporting pipelines — or send an email to discuss a bespoke project.